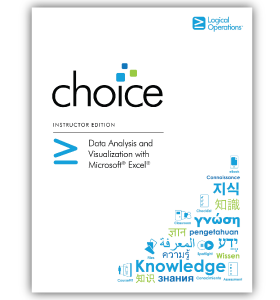
Welcome to Logically Speaking. This issue focuses on the launch of a single course: Data Analysis and Visualization with Microsoft® Excel® (D.A.V.E.). D.A.V.E. provides the perfect launchpad for moving your Excel students into the in-demand skills of Data Analysis and Data Science.
In this issue:
- Growth Opportunities
- Keys to Selling
- Interview with Bob Carver
- Curriculum Corner
- Latest Products
- Teaching Prep
- Building your Data Science Team
- Meet Tamara Hagen
- Subscribe
Help us communicate more relevant information to you by answering two questions to update your market segment and role. Take survey.

Everyday Data Scientist Is Your Typical Excel User
by Jon O'Keefe, MCCT, Technology Education Jedi
 Data is the most valuable resource of the next 10 years. 7 of the 10 most profitable companies have built a business model predicated on tying human behavior to data. Every company is looking to extract maximum value from their data, which is why LinkedIn has identified the role of Data Scientist as one of the fastest growing jobs in the United States.
Whether your clients are large, Fortune 500 companies or medium to small businesses, there is one ubiquitous Data Science and Analytics tool: Excel. Excel is the one constant across the ever-changing Data Science field. Every company has Excel users, and for many it is their only Data Science program. People are now learning Excel with Data Science in mind, and your typical Excel user is now an everyday Data Scientist.
If you’re offering Excel training, you’re now offering Data Science training. Whether we are talking about PivotTables or prescriptive analytics utilizing the Data Analysis Toolpak, your customers want to strengthen their Data Science skillset in Excel. The future of Excel training is in training these everyday Data Scientists on the skills they need to help their businesses be successful.
________________________________________
D.A.V.E. First Teach Opportunity
by Jon O'Keefe, MCCT, Technology Education Jedi
By now, we hope you've heard about your opportunity to participate in the Data Analysis and Visualization with Microsoft® Excel® (D.A.V.E.) First Teach. The response to this Event is overwhelmingly positive. It is easy for you to participate and benefit too. 
- Promote the class to your Excel students and you will receive $45 revenue share for each student that registers using your unique URL.
- Use the marketing materials already created to promote D.A.V.E. There are sample emails, a promo video, and images to use in emails and on social media to promote the class. Simply add your branding and get started!
- Sign up your trainers so they are prepped on this new course and ready for the demand.
Reach out to your Sales Rep to reserve a unique URL for your students. The URL will track your registrations, so we can send you $45 per student at the end of the event. We will even include a list of participating centers at the end of class so students can reach out to you to receive more training.

The D.A.V.E. Target Student Is?
by Jim Gabalski, Vice President Sales and Marketing
Who are the best prospective students to talk to about D.A.V.E.? You’ve already had them in class, most likely Excel Level 2, and they live in a job role of _________ Analyst.
 There are almost 92,000 open positions on Indeed.com for Analyst positions. Topping this list: Compliance Analyst (31,000), Business Analyst (22,000), Sales Analyst (22,000), Data Analyst (22,000), Marketing Analyst (19,000), and Finance Analyst (8,700). And the most common software that they use to aggregate and analyze data? Excel. You guessed it. In fact, a cursory examination of a handful of these open positions illustrates that “Proficient in Excel” is one of the top Preferred Qualifications.
The biggest challenge of any Analyst’s daily activity is preparing data for analysis. This involves extracting data from disparate systems and creating an analytical dataset. The second biggest challenge is performing the analysis using advanced functions in Excel. And the third biggest challenge is creating impactful, story-telling visuals. Along with foundational data analysis skills, D.A.V.E. addresses data prep, data analysis using Excel functions, and advanced visualizations, such as geospatial charting.
To be successful with selling D.A.V.E., look to your past Excel students and find the ones that are ________ Analysts, and you are well on your way to filling a class.
________________________________________
An Interview with D.A.V.E. Co-Author Bob Carver
by Jon O'Keefe, MCCT, Technology Education Jedi
 Bob Carver specializes in content strategy, training, and consulting on data analysis, digital marketing and cloud technologies. A former Microsoft Certified Trainer, Bob has run a training and marketing agency since 2000. In 2012, he refocused Carver Technology Consulting LLC to emphasize analytics-driven content marketing, training, and development. Let's see what insights Bob has about D.A.V.E.
Jedi Jon: Can you tell us the types of students who will benefit from taking D.A.V.E.?
Bob Carver: I see four different types of students:
- Excel Power Users focusing on Data Analysis: People who use Excel multiple times a week and wish to improve their skills to become full-fledged Data Analysts.
- Excel Data Analysts who want to learn visualization.
- Accidental Data Analysts: This is by far the biggest group. So many roles now have access to large amounts of data and involve some form of analysis and reporting. Those people know that the more they do it, the more they're asked to do it. This class gets them the skills they need to do data analysis well, and to present the results in the right way.
- The Data Reporter: This is the person who only occasionally needs to dive into data and to make some visuals to report it. These people are at the starting point to becoming accidental Data Analysts.
Jedi Jon: How is D.A.V.E. different from a standard Part 2 or Part 3 Excel course?
Bob Carver: A lot of the same fundamental knowledge is included because it has to be (tables, formulas, functions). But where Excel Parts 2 and 3 are features classes teaching you everything you might need to make Excel walk and talk, the D.A.V.E. course assumes specifically that you need to connect to data, analyze it, and present it. Everything comes back to the four key steps: Get your data into Excel. Prepare it for analysis. Do the analysis. Present the analysis effectively.
Jedi Jon: When you were writing D.A.V.E., what was the one skill or activity you were most excited to include?
Bob Carver: The best practices for presenting charts. It really is a game-changing way to look at how to communicate with visuals. It gets students away from just throwing data up on a slide for others to figure out and moves them to crafting and expressing specific messages. That approach will help anyone who takes the course communicate better in any job role.

How D.A.V.E. Fits in with the Current LO Excel Portfolio
by Nancy Curtis, Vice President, Content
Data Analysis and Visualization with Microsoft® Excel® (D.A.V.E.) adds a new two-day training option to the existing Logical Operations Excel content portfolio. Now you have even more ways to tailor Excel training delivery to your customers’ needs.
 Most learners should start with Microsoft® Excel® for Office 365 (Desktop or Online): Part 1. Too often skipped because learners assume that they “get” Excel, Part 1 is an important launch pad to ensure every professional grasps key skills and concepts.
- Do the students want to pursue Microsoft Excel certifications? Great! Continue on with our core MOS-aligned certification series: Microsoft® Excel® for Office 365 (Desktop or Online): Part 2 and Part 3. These courses both help prepare for certification success, and also ensure that users are comfortable with Excel on the desktop and on the web.
- Are the learners tasked with serious data analysis and data presentation responsibilities? Then they should head right to D.A.V.E., which focuses on those capabilities within Excel and takes them to their very limit.
- Do the students need the “best” of Excel, but in a concise way? Offer Excel Dashboards, which covers the most-needed Excel skills in a one-day format. “Microsoft® Excel® for Office 365: Dashboards” is coming soon! (It will be a subset of the material in D.A.V.E.)
- If students have little time and want to focus on advanced tools, they can bolt on to their training path with “Microsoft® Excel® for Office 365: Data Analysis with PivotTables” and “Microsoft® Excel® for Office 365: Data Analysis with PowerPivot.” These half-day offerings might be just the specialized capstone they need.
And that’s how to leverage the full Logical Operations Excel portfolio to meet all your customers’ Excel learning needs.
________________________________________
Instructor Editions? Student Manuals? What’s the diff?
by Nancy Curtis, Vice President, Content
No matter what Logical Operations CHOICE course you are teaching, you know that you benefit from our structured, instructional design approach and our standardized and consistent product features.
What you might not know is how the Instructor Edition (IE) and Student Manual (SM) versions of our courses complement each other.
How are they the same? 
- Pagination and page breaks are consistent. For a specific course revision level, the page you see is the page your students see, no matter how many times the course revises.
- All key instructional content is in the Studnt Manual, same as in your IE. Nothing that’s key to learner understanding and success is held back. You can concentrate on your presentation and your students’ progress, not just one-way information transfer.
How are they different?
Three key areas:
- Following the table of contents in the IE, “Using the…Instructor’s Edition” includes:
- A key to the IE-only icons.
.png)
- General presentation tips for the course as a whole.
- Technical requirements and setup instructions.
- Presentation Planners for suggested course flow across business days or for a session-based, seminar-style presentation.
- A key to the IE-only icons.
- The margins of the IE provide instructor-only tips and cues. Extra information? Alternative approaches? Available slides? Check the margins of your IE for useful course-specific info gleaned from our SMEs, authors, and in our live instructional testing.
- Suggested responses for question/answer activities appear right on your page in the IE; no flipping or scrolling. For students, these are blank so they can challenge themselves to respond and to offer their own thoughts. Suggested responses are compiled for them in a Solutions section at the back of the SM.
We’re proud of the IE/SM design and how our proprietary XML-based authoring and publishing system makes this magic happen. We hope this information will help you get even more out of your LO teaching experiences.
________________________________________
 Join the Logical Operations Instructor Community on Linkedin.
It is a place for instructors to connect with colleagues to share ideas, feedback, and insights related to instructor-led training.
________________________________________
Latest Product Highlights
Coming Soon--available in February:
Data Analysis and Visualization with Microsoft® Excel®
For a complete list of current and updated courses, download the Product Summary Guide below.
Download the latest Product Summary Guide
to see the full list of available titles and recent updates>

D.A.V.E. First Teach – Instructor Opportunity
by Jon O'Keefe, MCCT, Technology Education Jedi
Logical Operations is offering a one-time-only First Teach for our new Data Analysis and Visualization with Microsoft® Excel® class. While this event is aimed at seeding the market with students who can recommend the class, it is also an excellent opportunity for instructors to prep the class.
For $99, an instructor will receive:
• Student and Instructor editions¹ of the courseware.
• Access to the data files and PowerPoint slides that come with the courseware.
• A seat in the class on February 24th and 25th.
• A copy of the recording of the class, broken into sections.
• Marketing materials to help promote your own classes after the first teach.²
Register Now!
________________________
¹Instructor edition will be provided after the first teach by contacting your sales rep.
²Marketing materials will be provided after the first teach by contacting your sales rep.
Download D.A.V.E. Course Outline
________________________________________
CustomCHOICE
by Andrea Montanarella, Manager, Custom Production
 Brand or Customize Data Analysis and Visualization with Microsoft® Excel® (D.A.V.E.) to take your students’ Excel skills to the next level! Personalize your offering by adding your logo - in black and white or in color - to the front cover of the standard book to market your organization. Or customize the content by choosing the lessons and topics you want to teach, and we will include the personalization for free!
Use our online CustomCHOICE tool for a free quote: Go to → store.logicaloperations.com → Log in → Choose “My Account” at the top of the screen → Choose “CustomCHOICE” on the left-hand navigation.
Watch a short CustomCHOICE demo.
For assistance contact Andrea, our Custom Print Manager:
cprint@logicaloperations.com||800-456-4677 Option 4||Direct: 585-350-7014

Building Your Data Science Team
by Patrick DiLaura, Chief Talent Officer
 Data Science is one of the fastest growing professions in the world. Organizations want to build out their Data Science and Analysis (DS&A) teams but are struggling to find the success they are looking for. If you have clients who are asking for help with this, Logical Operations has outlined FIVE different Data Science team roles.
- The Data Wrangler—The person responsible for taking all the data from a variety of disparate datasets and organizing them into a single, structured dataset.
- The Data Detective—The person responsible for investigating the datasets, making sure to remove any anomalous data.
- The Data Artist—The person responsible for turning the data into a visualization or story that matches the company’s values and ethos.
- The Data Automator—The person responsible for turning manual data projects into automated workflows using Machine Learning/A.I.
- The Data Connector—The person who can present the findings of the Data Science team to others inside the organization, and who can help guide decisions based on the data.
For many organizations, one person will be expected to do all five roles at the onset. However, as organizations invest more in their Data Science teams, this breakdown has been proven to provide a strong ROI.
________________________________________
Meet Tamara Hagen, Instructional Designer. Content Group
 I have lived most of my life in Rochester NY, although I have also lived in Montreal, Madison WI, and Chicago. There are two common threads to my career—data analysis and teaching—and it’s great to be able to combine them as an Instructional Designer for the last five years at LO.
It’s my job to break down complex ideas into smaller pieces so people can learn more easily. I’ve developed courseware on many topics for LO—business presentations, our Modern Classroom Certified Trainer curriculum, and PowerPoint and Excel skills. Most recently, I’ve been involved with courses in our Data Science curriculum path, including the Tableau and Power BI courses, and the new Data Analysis and Visualization with Microsoft® Excel® (D.A.V.E.).
Obviously, a big part of what an Excel course needs to teach is the technical skills to create a chart or map. But I believe we also must help people understand how to choose the best visualization to support the point that they want to make about their results. I believe the D.A.V.E. course will help students become good data storytellers.
Outside the office, I spend my time training and competing in agility with my dogs, Riley and Salsa.


